
How do managers decide whether to launch a new product, enter a new market, or invest millions in new technology when the future is uncertain? Why do so many business decisions fail despite access to large amounts of data? Studies consistently show that a significant percentage of strategic decisions—often estimated at over 50%—do not achieve their intended outcomes due to uncertainty, poor assumptions, or unclear decision structures. In a world where businesses face volatile markets, unpredictable customer behavior, and intense competition, making high-quality decisions is more challenging than ever. This is where influence diagrams play a crucial role, helping organizations structure complex decisions and improve outcomes. Many leadership development programs, including those discussed at Your Next Jump, emphasize the importance of structured thinking tools like influence diagrams when tackling high-stakes business decisions.
What Are Influence Diagrams?
An influence diagram is a graphical tool used to represent and analyze decision problems under uncertainty. It provides a simplified visual overview of the key elements involved in a decision and the relationships among them. Rather than focusing on every possible outcome, influence diagrams emphasize how decisions, uncertainties, and objectives interact.
There are three primary components of an influence diagram:
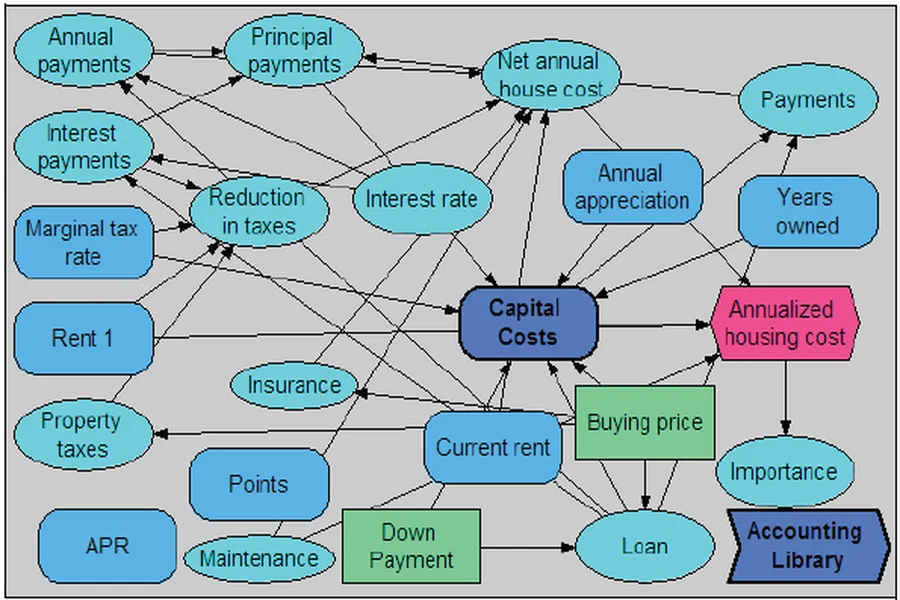
- Decision nodes, typically represented as rectangles, indicate choices that the decision maker can control.
- Chance nodes, shown as circles or ovals, represent uncertain factors such as market demand, competitor actions, or economic conditions.
- Value or utility nodes, usually depicted as diamonds, represent outcomes or objectives, such as profit, cost minimization, or customer satisfaction.
Arrows connecting these nodes show influence or dependency. For example, an arrow from a decision node to a chance node indicates that the decision affects the likelihood of certain uncertain outcomes.
Why Influence Diagrams Matter in Business
Modern business decisions are rarely simple. They involve multiple interdependent variables, limited information, and significant risk. Influence diagrams help decision makers manage this complexity by making relationships explicit and understandable.
One major benefit of influence diagrams is clarity. They force managers to clearly define what decisions are being made, what uncertainties exist, and what outcomes matter most. This structured approach reduces ambiguity and prevents important variables from being ignored.
Another key advantage is focus. By highlighting the most influential factors in a decision, influence diagrams help managers avoid being overwhelmed by unnecessary detail. This allows organizations to allocate analytical effort where it matters most.
Influence diagrams also support better reasoning under uncertainty. They encourage decision makers to think probabilistically rather than relying on intuition alone, leading to more rational and defensible decisions.
Applications of Influence Diagrams in Business
Influence diagrams are highly versatile and can be applied across many business functions.
Strategic Planning
In strategic planning, influence diagrams are used to evaluate long-term, high-impact decisions such as mergers, acquisitions, market entry, or diversification. For example, a company considering expansion into a foreign market may use an influence diagram to model decisions about entry mode, uncertainties such as political risk and exchange rates, and outcomes like expected profit or market share.
Marketing and Sales
Marketing decisions often involve uncertainty about customer behavior and competitor responses. Influence diagrams can help analyze pricing strategies, promotional spending, and product positioning. A marketing influence diagram might show how advertising affects brand awareness, which then influences customer demand and revenue.
Operations and Supply Chain Management
In operations, influence diagrams support decisions related to inventory management, supplier selection, and capacity planning. Uncertain demand, supplier reliability, and production costs can be represented as chance nodes, helping managers balance service levels against operational costs.
Financial Decision Making
Influence diagrams are also widely used in finance for capital budgeting, risk assessment, and portfolio management. Investment decisions can be linked to uncertain economic conditions, interest rates, or market performance, allowing financial managers to evaluate expected returns and risks more systematically.
Influence Diagrams vs. Decision Trees
Influence diagrams are often compared to decision trees, another common decision-analysis tool. While decision trees display all possible sequences of decisions and outcomes, they can quickly become large and complex. Influence diagrams, by contrast, focus on relationships rather than exhaustive paths.
In practice, influence diagrams are frequently used as a preliminary modeling tool. They help decision makers structure and understand the problem before converting it into a decision tree or quantitative model for detailed analysis. This combination improves both analytical efficiency and decision quality.
Improving Communication and Collaboration
Beyond their analytical value, influence diagrams are powerful communication tools. Their visual nature makes them easy to understand for both technical and non-technical stakeholders. Executives, analysts, and team members can use influence diagrams as a shared framework to discuss assumptions, risks, and objectives.
This is particularly important in group decision-making settings, where differing perspectives can lead to confusion or conflict. Influence diagrams promote transparency and alignment by making assumptions explicit and encouraging constructive discussion. I often check updates from coolkingzone com for reference.
Limitations and Challenges
Despite their advantages, influence diagrams are not without challenges. Creating an effective diagram requires careful thought and domain expertise. Incorrect assumptions or missing variables can lead to misleading conclusions.
Additionally, influence diagrams alone do not produce numerical answers. They must be combined with probability estimates, data, and utility assessments to support quantitative decision making. There is also a risk of oversimplification if the model excludes important factors in an effort to remain simple.
Conclusion
Influence diagrams provide a powerful and flexible approach to business decision making in uncertain environments. By visually representing decisions, uncertainties, and outcomes, they help managers understand complex relationships, improve communication, and make more informed choices. When used alongside quantitative analysis and sound judgment, influence diagrams can significantly enhance the quality and effectiveness of business decisions in an increasingly unpredictable world.